< Gallery / Templates
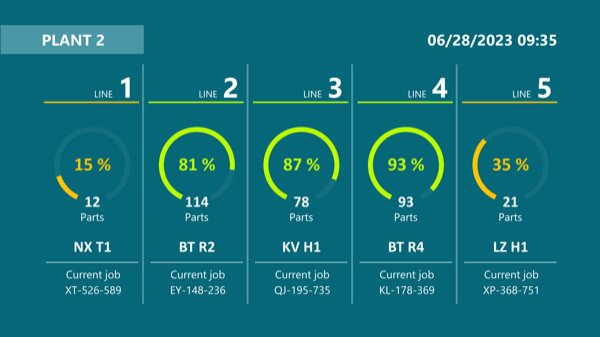
Visualization of machine data – dashboard for an overview of your production line
ALL,
RECOMMENDED,
SERIES PRODUCTION,
OEE,
LEAN MANAGEMENT,
SHOPFLOOR
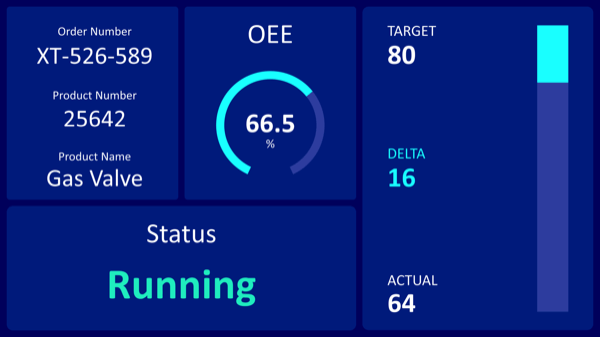
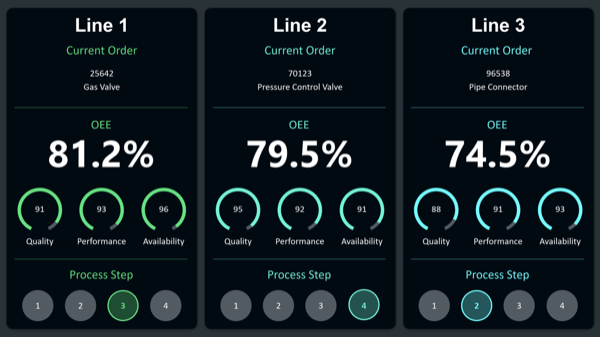
With this template you can monitor your machines in real time! The freely configurable visualization offers you the possibility to display machine data of a single production line in a flexible, automated, and easy-to-use way. With a quick glance at the dashboard you know, for example, the quality level of the current cycle, the cycle length, or the overall system effectiveness (OEE). By replacing the timer script as well as the variables, you can customize the template according to your needs. Download now!
Open file with Peakboard Designer
possible data sources
This template uses Peakboard variable lists as fictitious data sources. In a real scenario you could connect your systems instead. Data for the different areas of this board could come from completely different systems. ERP systems like: abas ERP, proALPHA ERP, Epicor ERP, Comarch ERP, QAD Adaptive ERP, SAP or many more. There could also be MES systems such as AIS Automation FabEagle MES, camLine InFrame Synapse MES, DELMIA Apriso MES, DE DESC, FASTEC 4 PRO, Felten PILOT:MES or Forcam Force connected. Or also machine-oriented communication methods such as: MQTT, OPC UA, Siemens S7, Azure Event & IoT Hub, Werma, Mitsubishi Electric, Beckhoff Automation, Bosch IoT Gateway, Rockwell Automation or MT Connect. There are many data sources you could use for this board, you can find an overview here.