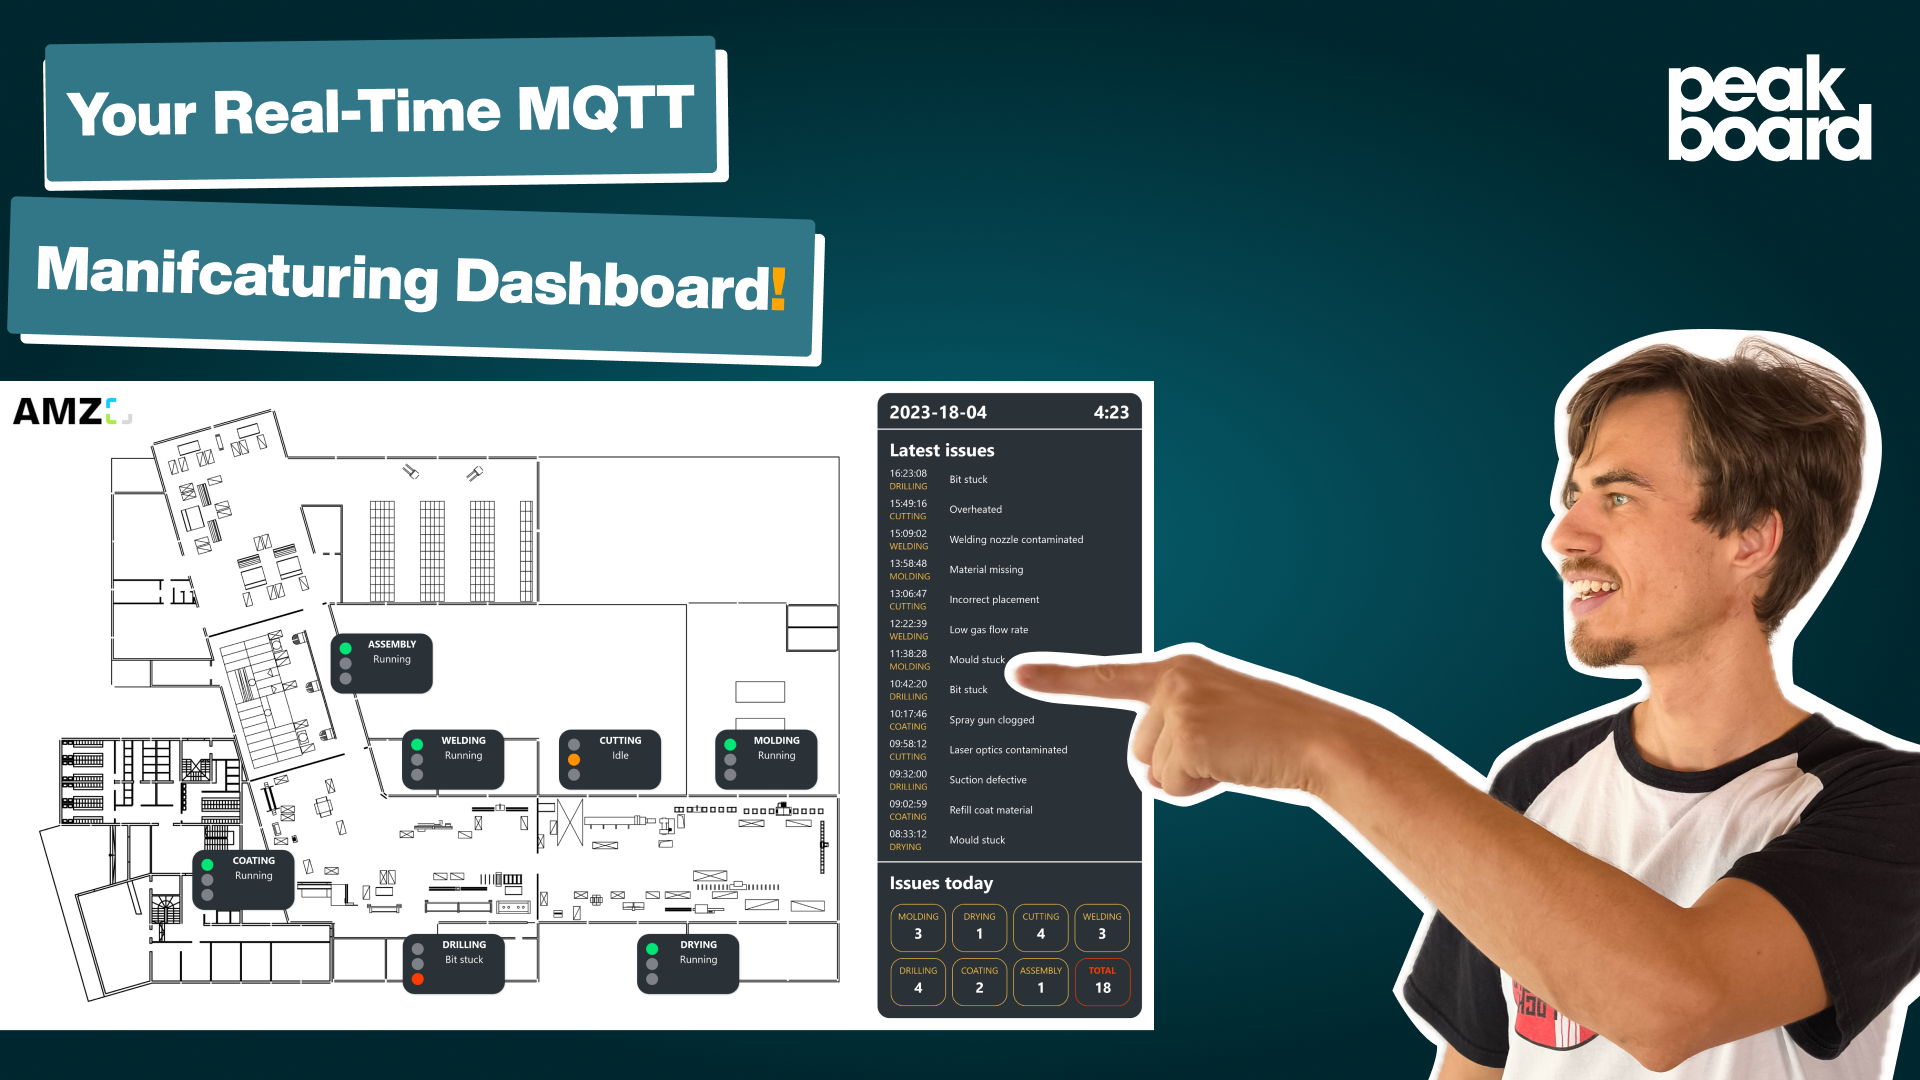
Real-time andon board – Effective monitoring of your production from a bird's eye view
ALL, SHOPFLOOR, ANDON, PRODUCTION, PEAKBOARD HUB, OPC UA
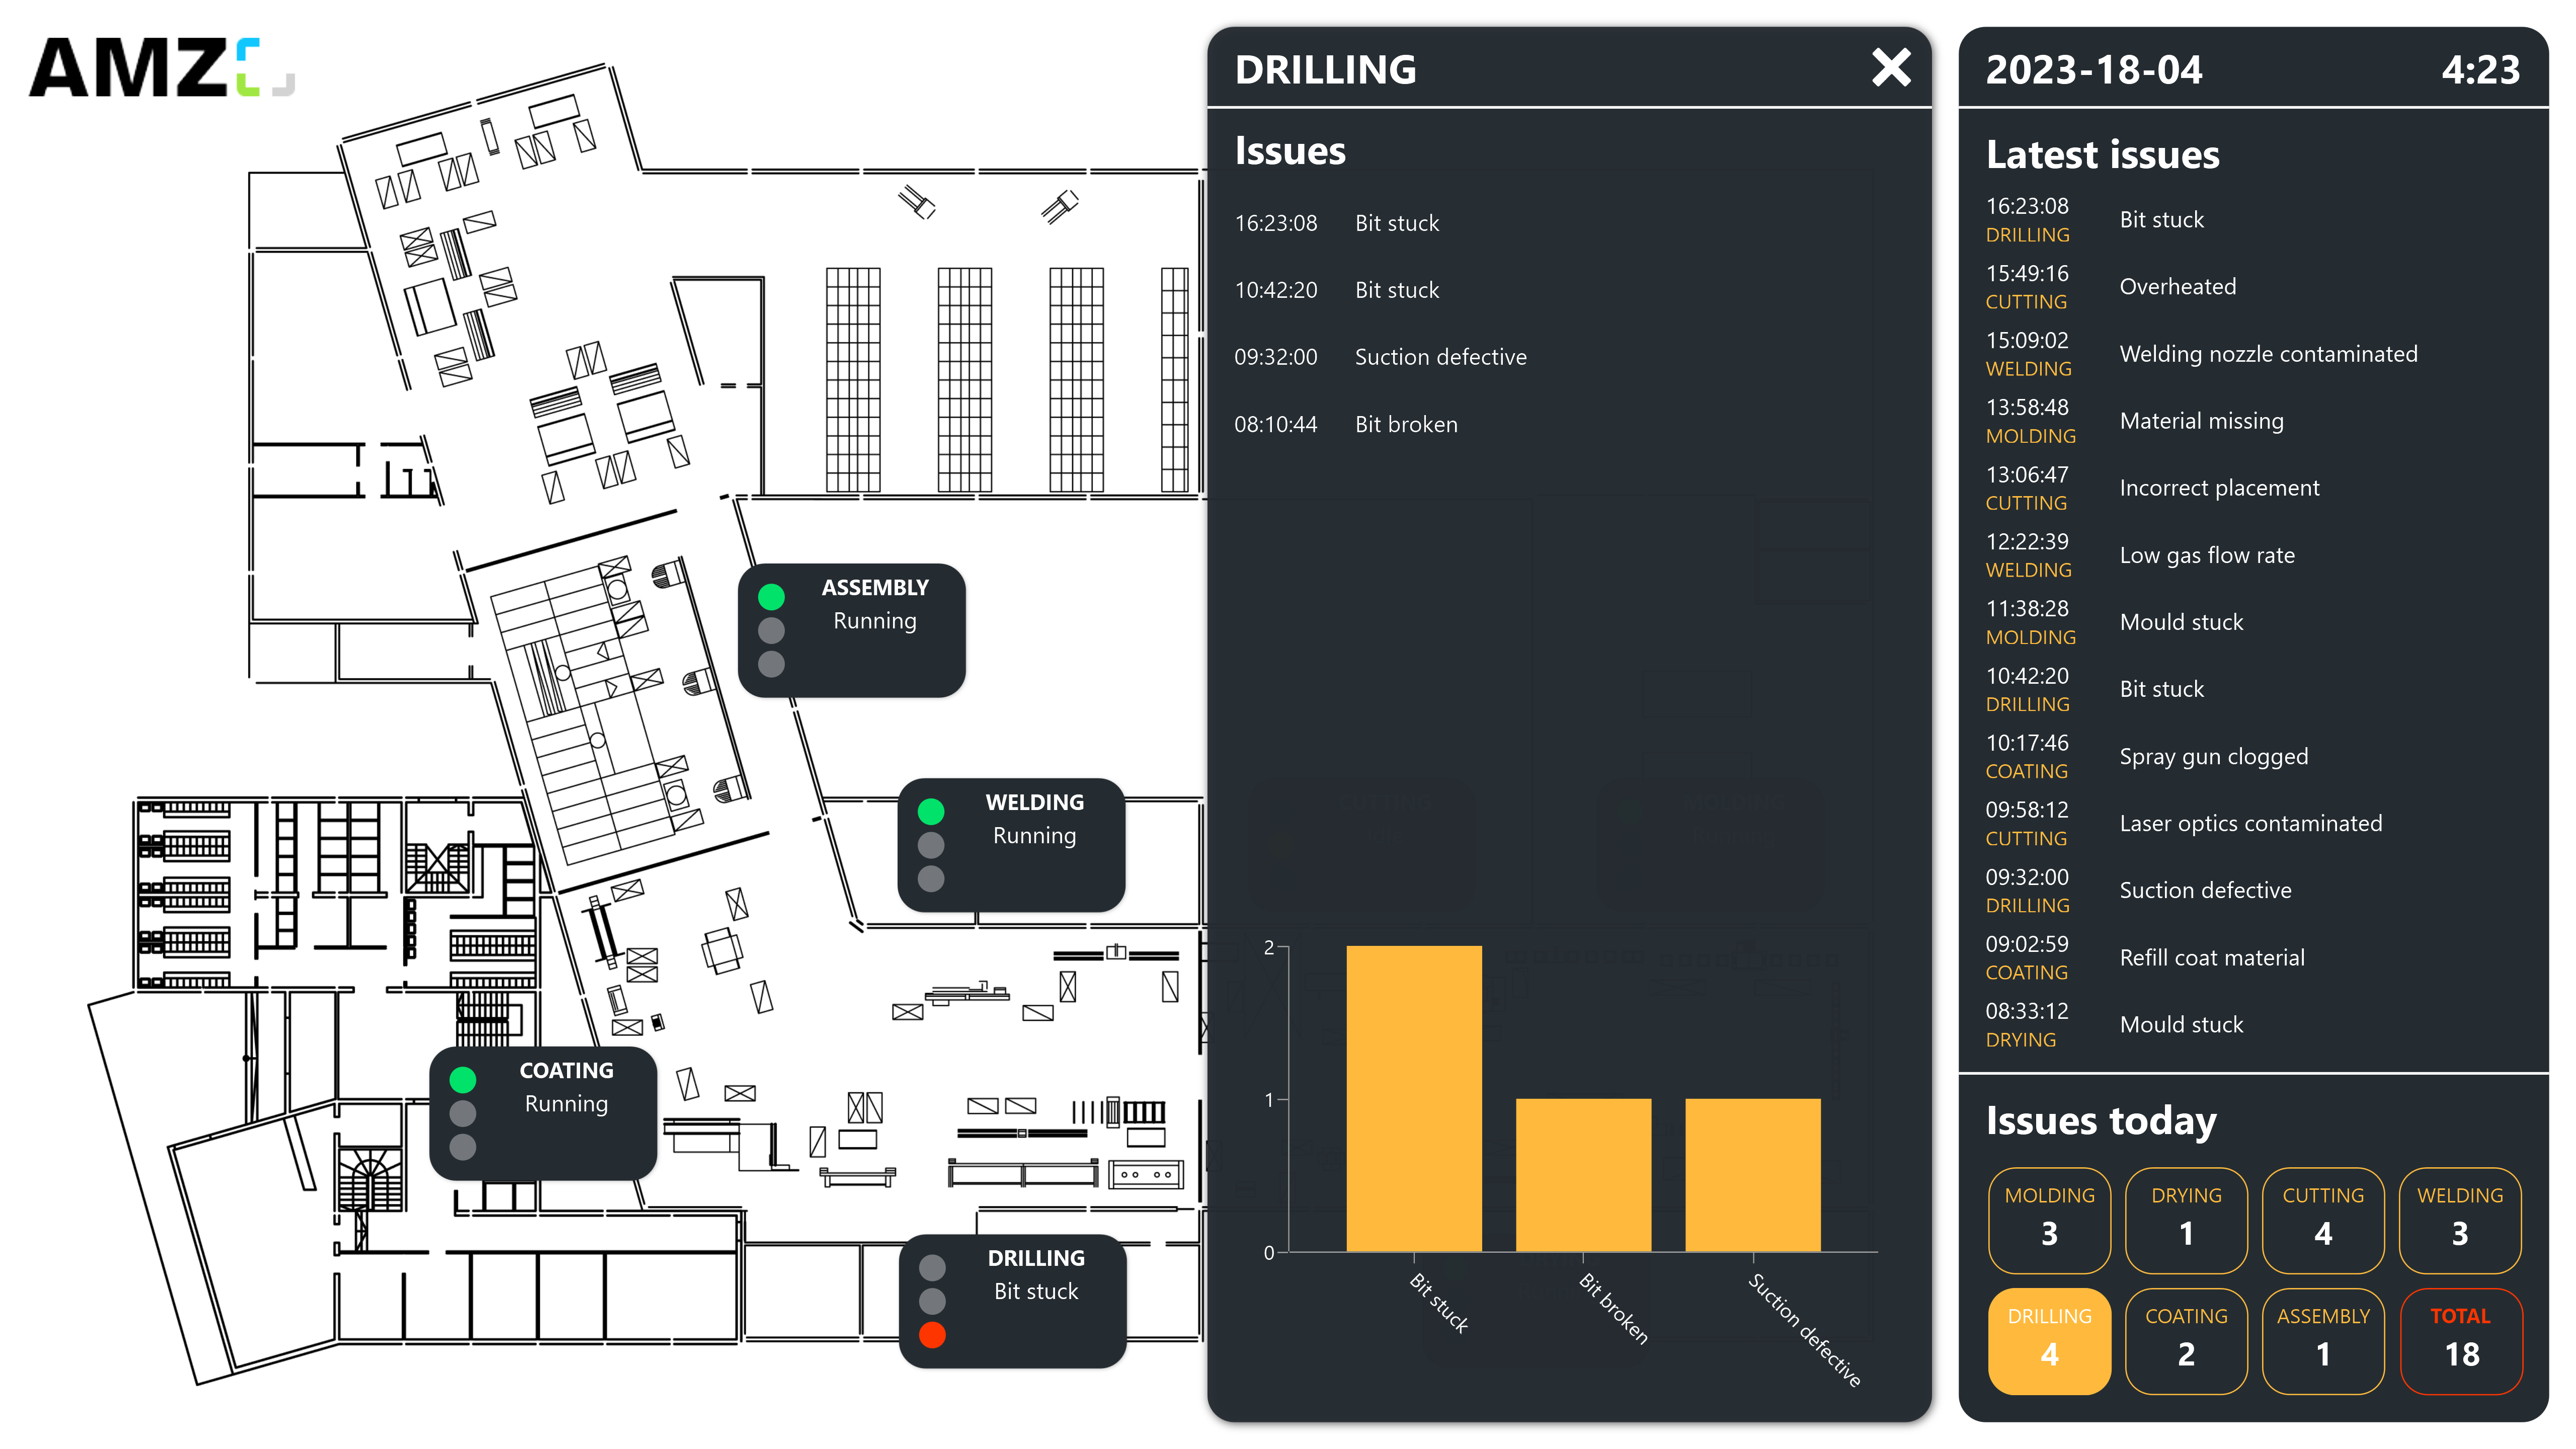
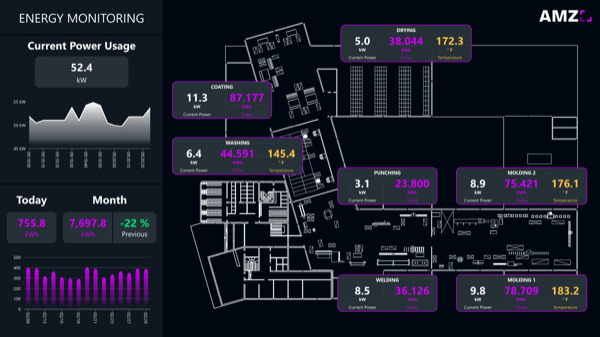
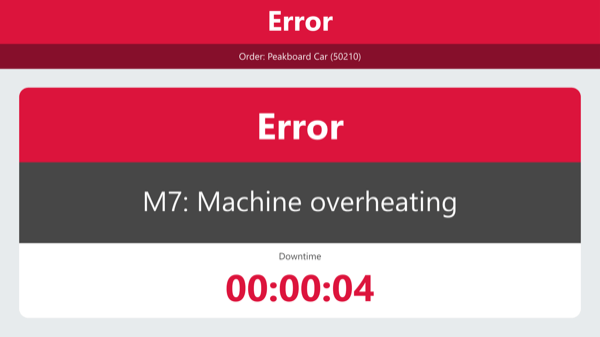
This andon board provides a bird’s eye view of your production facility and uses an andon traffic light to visualize the current status of each of your machines in real time. Green shows that the machine is running, yellow means that the machine is being configured, and red indicates an error. In the event of an error, the reason for it is also displayed directly. This way, you can immediately identify deviations and malfunctions and react to problems swiftly, which leads to higher productivity and better quality in your production.
In addition, the application saves all occurring errors in a Peakboard Hub list. The persistent data is displayed in the right pane of the dashboard. This shows both the recent issues and the total number of incidents for that day.
Using a touchscreen or a mouse connected to the Peakboard Box, you can click on the tiles in the lower right area. This opens a window displaying a detailed list of errors and analysis of the respective machine. The continuous monitoring, documentation, and analysis of errors let you identify the causes and achieve long-term improvements in the production process.
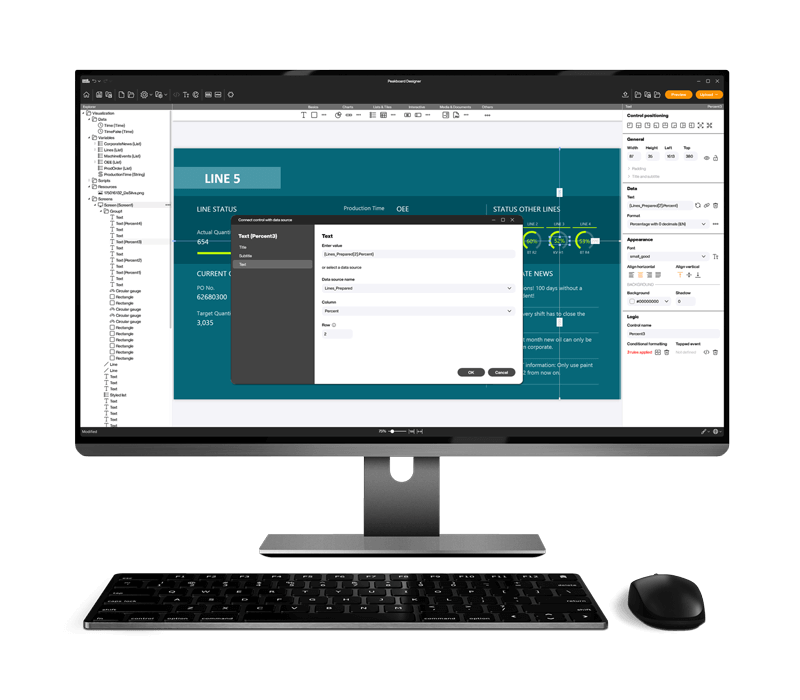
Download the template now for free and adapt it to your company’s production environment without any programming effort. For even easier usability, all scripts in this template were created with Peakboard Building Blocks, our low-code script editor.