< Gallery / Templates

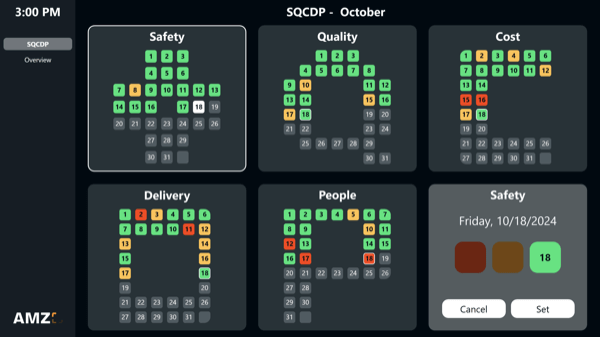
Interactive calendar view for production planning

ALL, SHOPFLOOR, PRODUCTION, INTERACTION, PEAKBOARD HUB

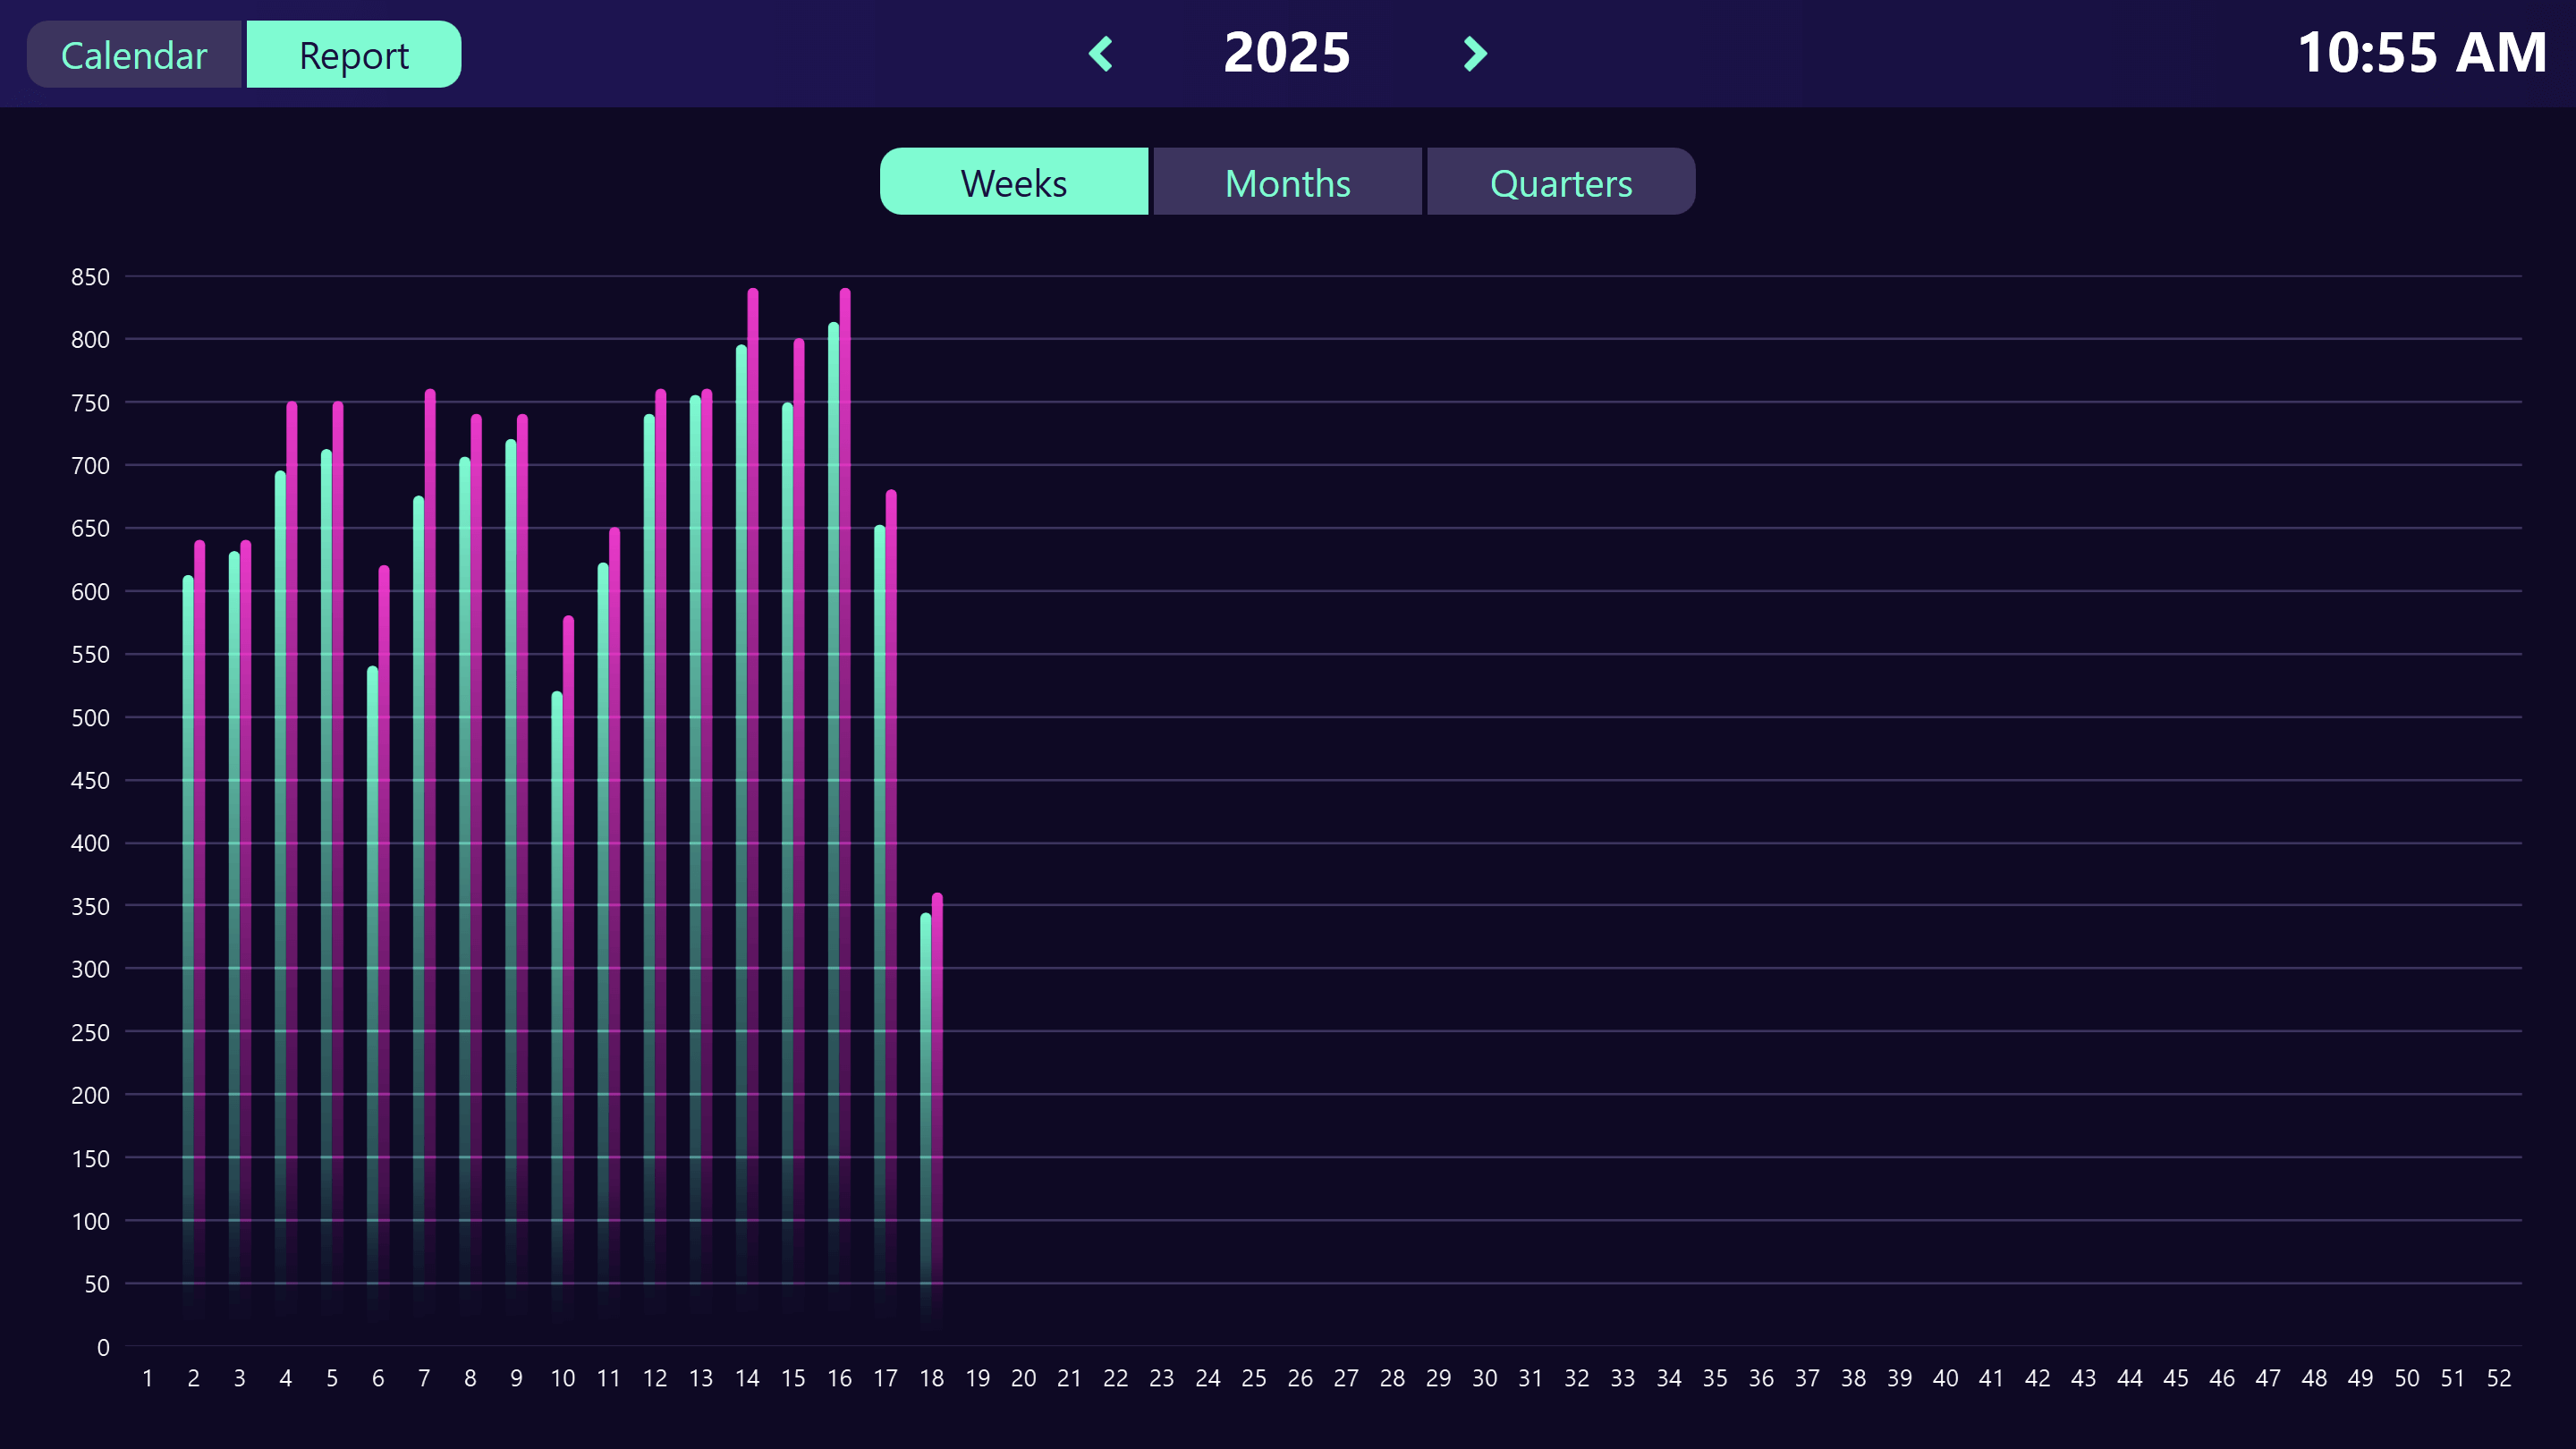
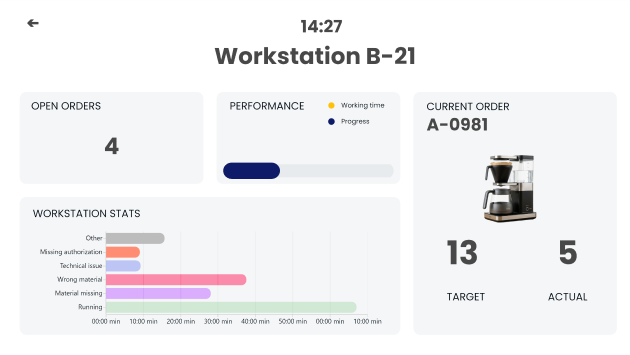
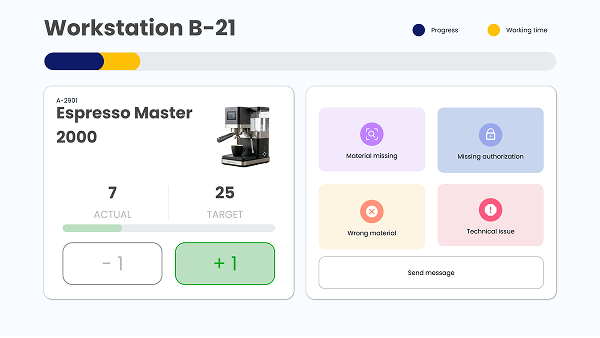
This interactive template helps you easily keep track of your production metrics. You can capture both actual and target values on a daily basis. The clear calendar view displays all relevant data for each day, allowing quick input and monitoring of production metrics. Additionally, the template offers a reporting view where the collected data can be analyzed by week, month, or quarter. This way, you always have control over your performance and can quickly identify trends and deviations. The template is ideal for production environments where daily metrics need to be recorded and analyzed. Download the template for free now and customize it to fit your individual production environment.

Possible data sources

This template uses a Peakboard Hub list as the data source. To use this template with your own Peakboard Hub, you can download the table structure of the list here. Import it into Peakboard Hub and then adjust the data sources in the template accordingly. Alternatively, the data could also come from various other databases.

Report view

In addition to the calendar view, the template also offers a reporting view, which aggregates the data for analysis purposes and displays it by calendar week, month, or quarter.image_live

Be enlightened!

Do you need more support?

Peakboard Youtube icon Visit our YouTube channel

Our numerous videos for beginners and advanced users explain exactly how to design your dashboard.

Peakboard Help icon Visit the Peakboard Help website

Check out numerous articles that will help you use the Peakboard Designer.

Peakboard icon Visit www.peakboard.com

Find out all about Peakboard and browse our different use cases and success stories.