< Gallery / Templates

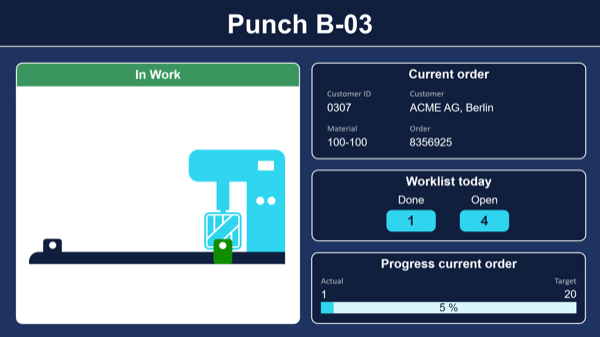
Production status of your bottling plants – dashboard with Peakboard Edge

ALL, PRODUCTION, EDGE

With this template, you can keep an eye on the performance of your bottling lines at all times and easily track the progress of your production. In addition, you can integrate further relevant data, e.g. from ERP systems, and help your employees to have an overview of the current production in real time. All you need is Peakboard Edge in combination with Peakboard Enterprise and a standard light barrier with a relay output. This template also lets you visualize the resulting data and communicate it immediately as a practical target-performance comparison. Download it now!

Open file with Peakboard Designer

possible data sources

This template uses the Peakboard Edge data source. Peakboard Edge can directly input and output information about external devices. Peakboard Edge does not communicate via a display, but is always connected to a Peakboard Box. Here you can learn more about Peakboard Edge.

As an alternative to Peakboard Edge, the status of the individual filling lines could also be obtained via machine protocols such as MQTT, OPC UA, Siemens S7, Werme, Mitsubishi Electric or via an MES. The following MES, among others, are supported: FASTEC 4 PRO, FORCAM FORCE, DELMIA Apriso MES and many more.

how it works

image_live

Be enlightened!

Do you need more support?

Peakboard Youtube icon Visit our YouTube channel

Our numerous videos for beginners and advanced users explain exactly how to design your dashboard.

Peakboard Help icon Visit the Peakboard Help website

Check out numerous articles that will help you use the Peakboard Designer.

Peakboard icon Visit www.peakboard.com

Find out all about Peakboard and browse our different use cases and success stories.